Test Building Approach
Measuring Incrementality via Geo-Testing
We set up incrementality experiments at the geo level, creating randomized, mutually exclusive groups of geographies wherein a specific action is applied to the test group(s) and NOT to the holdout group.
Simply put, we then measure the difference in business results recorded during our test period between the test and holdout groups.

Pre-Test: Creating Test & Holdout Groups
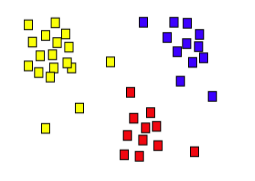
Step 1
Geos (ex. all US DMAS) are statistically ‘clustered’ into groups of likeness based on KPI performance.
Step 2
Clusters are divided evenly between groups based on the proportion of geos we want in our test group(s) vs holdout
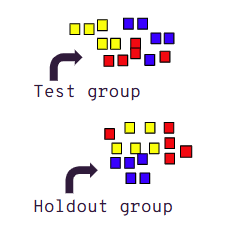
Step 3
This translates into balanced geo groups that are predictive of one another and removed of any bias inherent in manual group selection
Pre-Test: Modelling
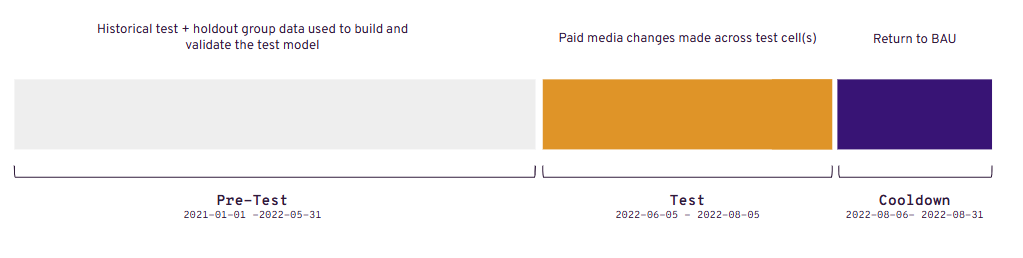
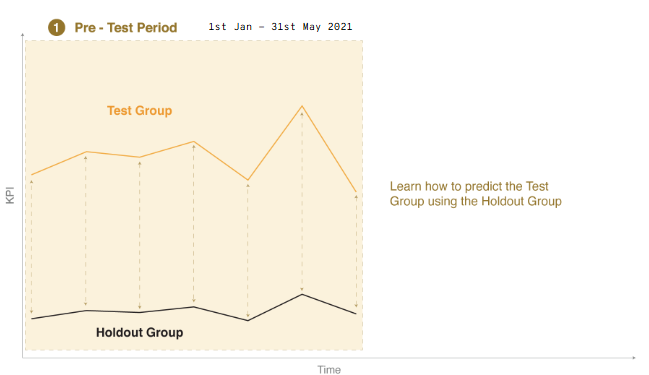
Before any test, there’s an exploratory period where we identify whether holdout group geos can be used to predict test group performance during our test period. To accurately predict test group performance, we build and validate statistical models using long-term historical data.
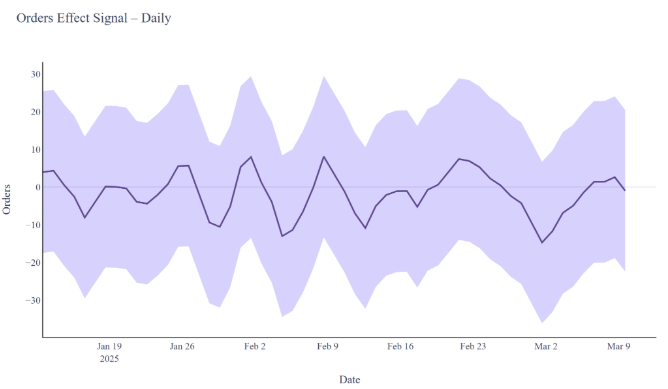
Pre-Test: Prediction Interval
To generate the prediction interval for our tests we run multiple backtests with randomized starting points. The errors are determined from the out-of-sample periods, and prediction intervals are estimated on the cumulative impact for the test period. This prediction interval is then used to determine the estimation accuracy and statistical power of the test.
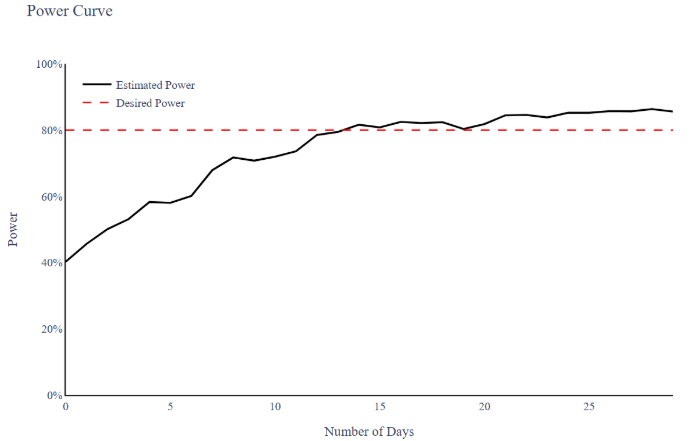
Pre-Test: Predict Performance
We predict model performance during the pre-test period by estimating accuracy and statistical power from backtests. For representativeness, the length of the backtest is set to match the desired test length. Accuracy is estimated through the backtest prediction confidence, while power is estimated by simulating assumed effect sizes in the backtest. We prioritize confidence over power to minimize false attribution of media impacts.
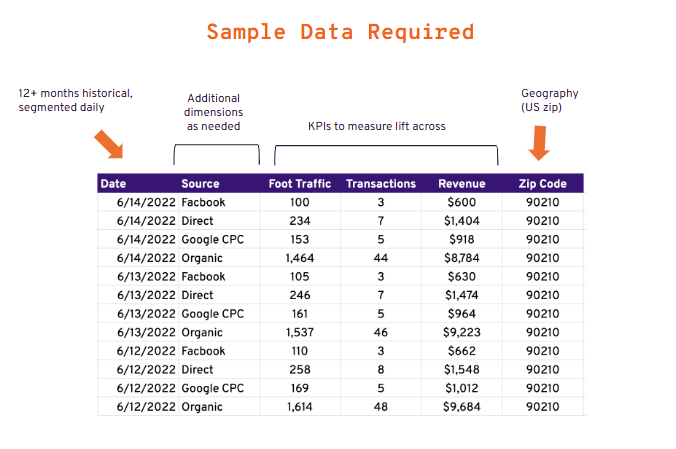
Pre-Test: Data Collection
To build models that can predict test group performance, we require at least 12 months of historical business data segmented by day and geo (ideally zip code) across the KPIs we plan to measure. Depending on your data source (CRM, Analytics etc) and KPIs, Thrive may be able to pull this information, or we will request a historical data dump, as well as collaborate to automate a daily data pull during the test period.
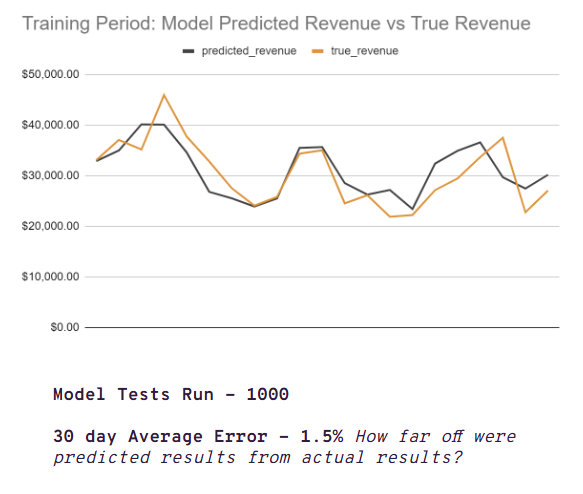
Pre-Test: Modelling
Once created, each model is tested hundreds of times over random periods of historical data, using the holdout regions results to predict test region results.
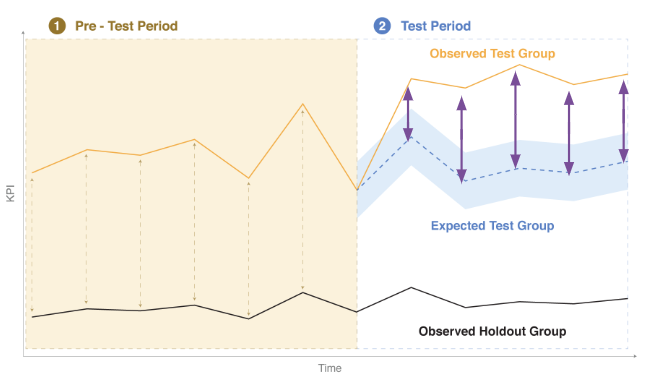
Test Period: Measuring Lift
Once the test has started, the model’s prediction of test results - ‘Expected Test Results’ - serves as a metric for how the test would have performed had no changes been made. Incremental impact is measured as the difference between observed test region results (ex. performance with ‘paid media off’), and the expected test group results.
| Test Cell 2 | Expected Revenue | Observed Revenue | Incremental |
|---|---|---|---|
| Action: Media Spend 2X | $2,200,000 | $3,200,000 | $1,000,000 |
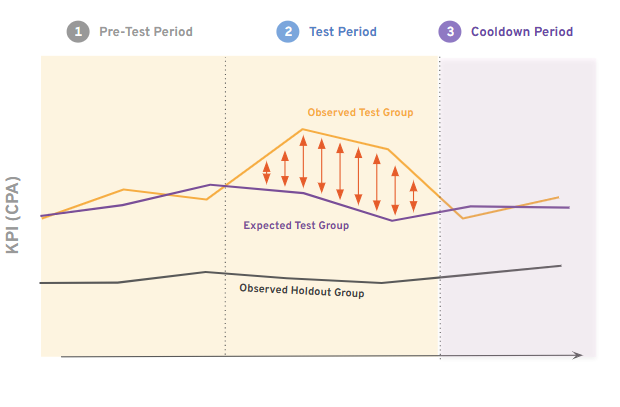
Cooldown: Measuring Lift
A cooldown period occurs after we’ve paused the test and reversed any actions made. During this time, we continue to measure incremental impact to account for latency, or how long it takes for the effect of ads to be seen. Cooldown observations provide a good indication of the how long it takes for advertising to impact different KPIs.
Testing Timeline