Tabs
Pipeline Tab
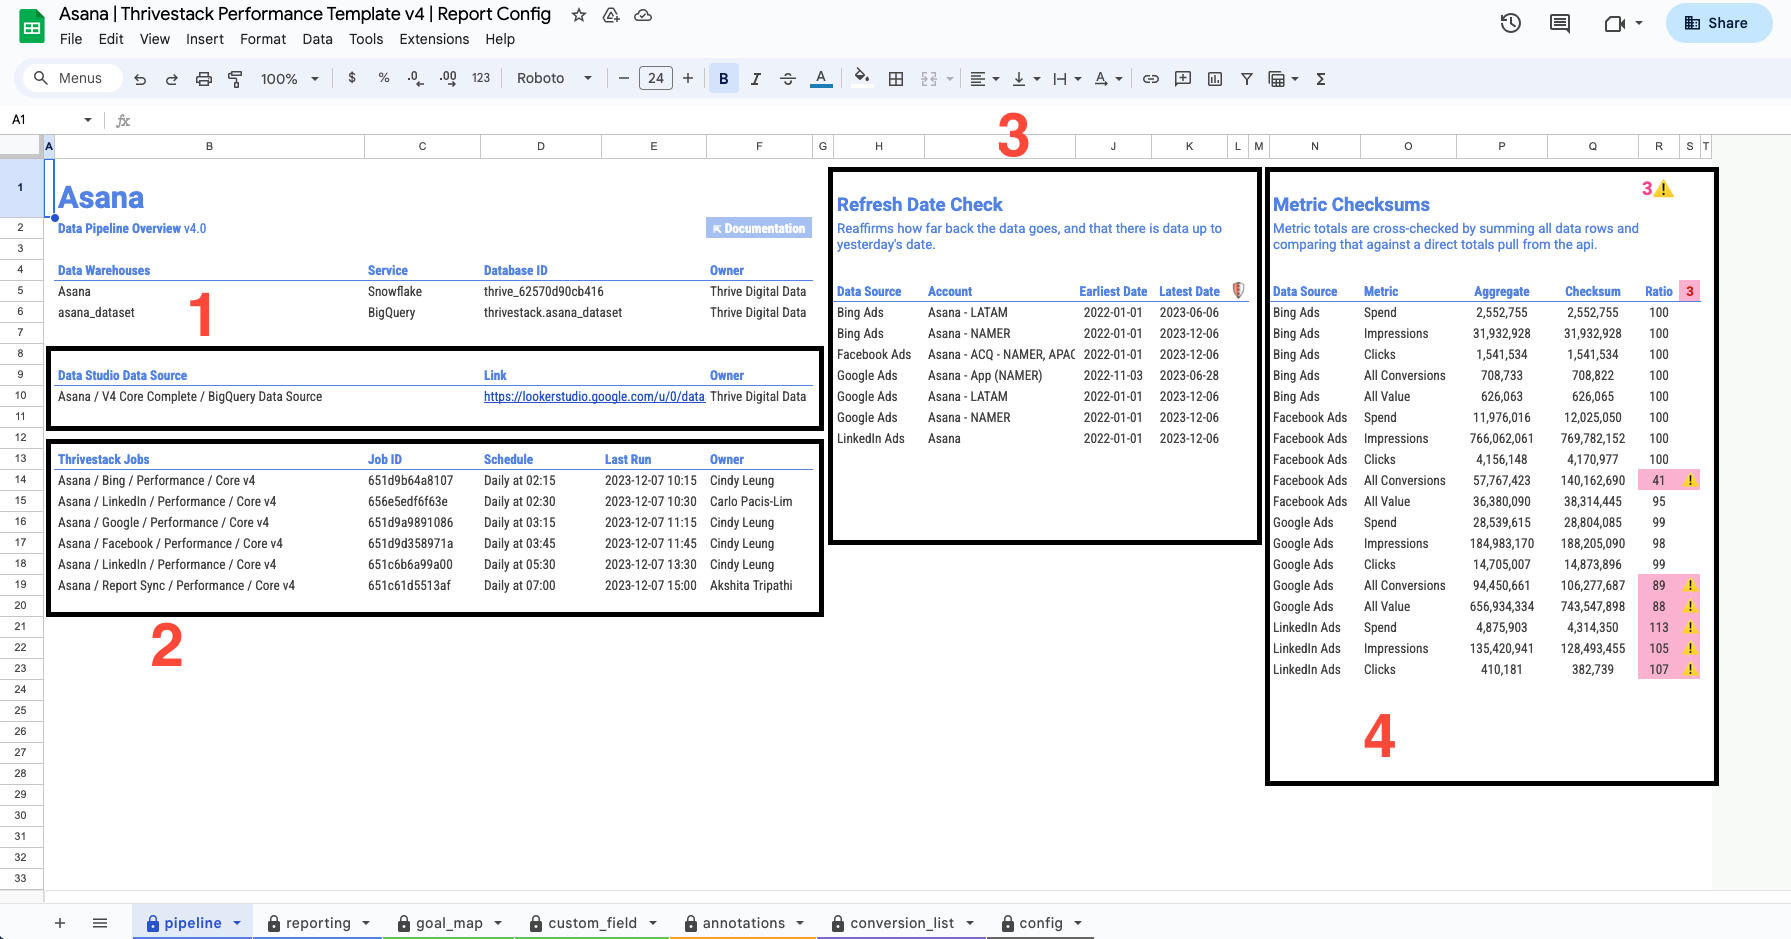
The purpose of the Pipeline tab is to summarize the Thrivestack jobs, where all the data is housed, and the health status of the data. You can spot right away whether data is out of date and what Thrivestack jobs need to be run to remedy this.
Background
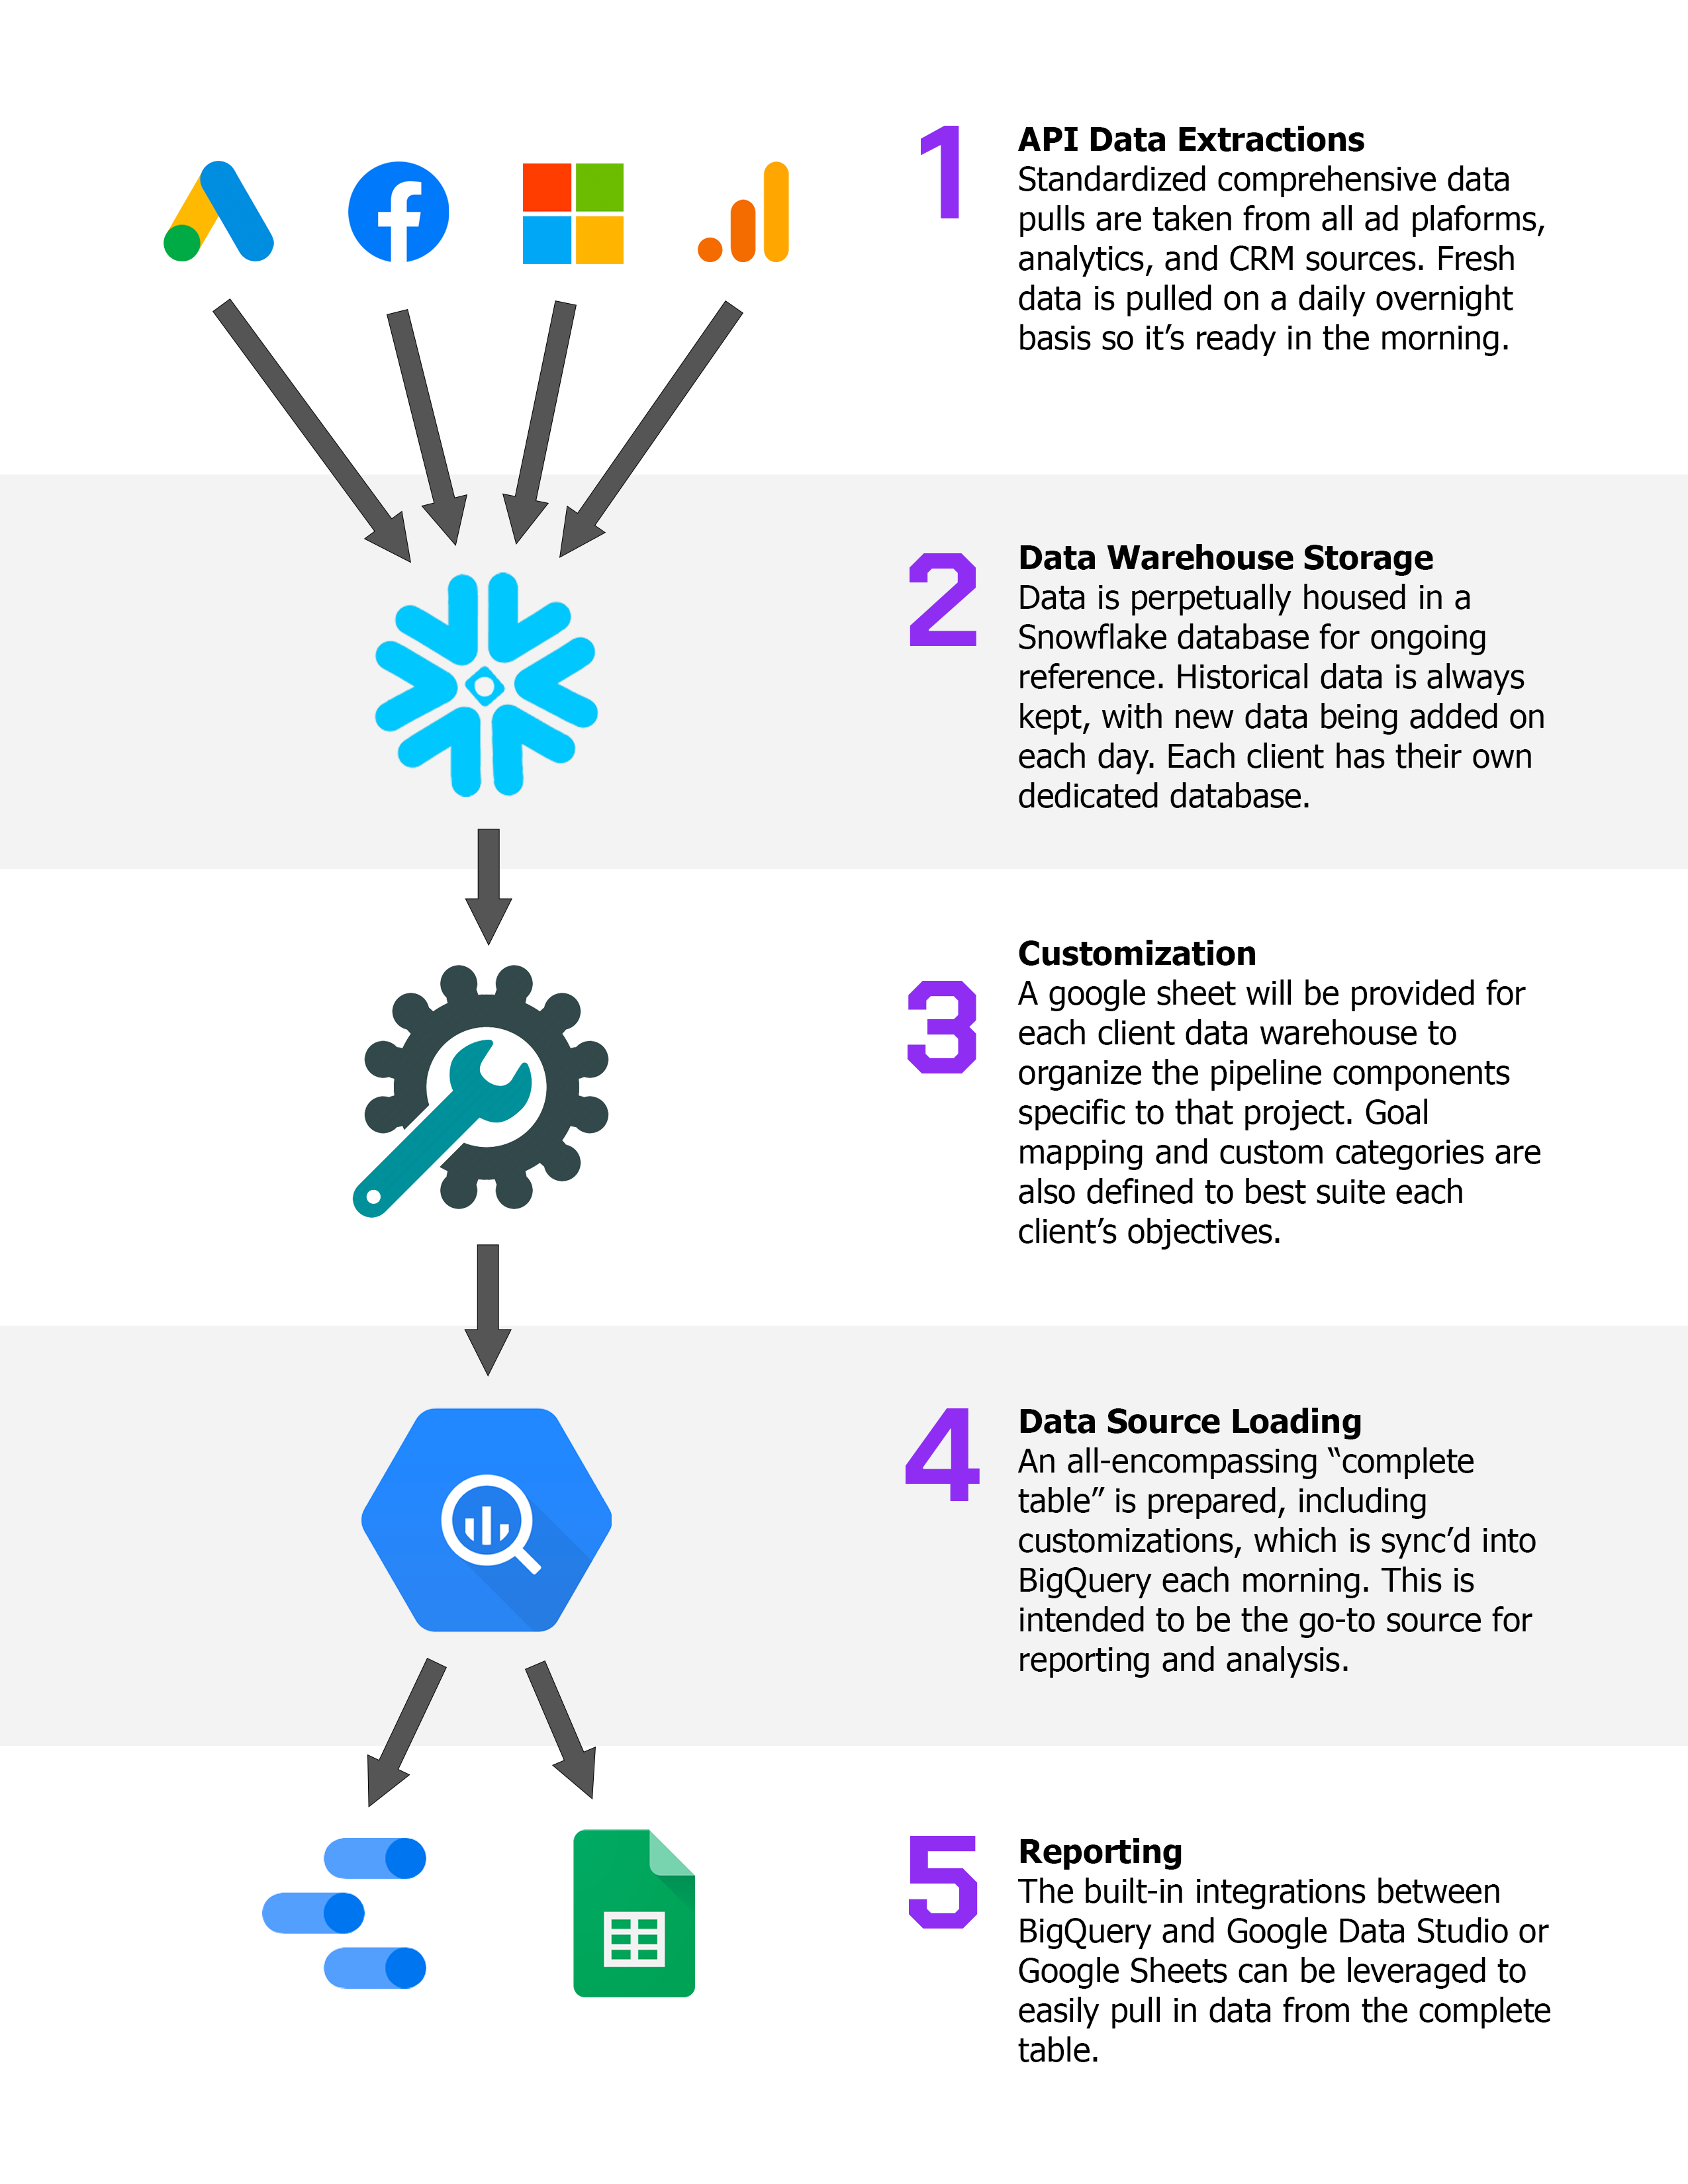
Our current data infrastructure stores data in two different places. The first one is Snowflake, and the second one is BigQuery. Our Looker Studio reports use the data that is in BigQuery.
The Pipeline tab of the config sheet comprises of:
-
Data Source : This is the link that contains the connection to the BigQuery dataset, which also connects to the Looker Studio reports. So when you're not able to refresh the Looker Studio report, you are missing permissions. Feel free to reach out to the data team.
-
Thrivestack jobs : These are the list of jobs that currently exist under that person's account, the last time they ran, and the scheduled time that they will run tomorrow.
-
Date Refresh Check : This area contains all the current platforms that are set up and their earliest and latest dates for which we have data. If you see anything red here, it means recent data has been missing since that date or no new data has come in. In this case, you can check point no. 2 above to see whether the job has run or not.
-
Checksums : This part of the sheet has all the details on what we have and how updated we are when it comes to data. The Ratio column defines if the data that we have matches the account-level data.
We usually keep some marginal error, as everything is not perfect. If the ratio is between 95% to 100%, this is good. If the ratio is below 95%, it means that data for some dates is missing, and if the ratio is above 100%, it means there's some duplicate data.
You can also view checksums in our Status page
:::tip Tip
If you see red highlighted cells in the Refresh Date Check section:
First, check if that job has run today and if this was a success (check the logs tab in TSK). Check the Report/GDS job and see if that was successful. Run the failed jobs [platform(s) first and then Report/GDS] and the logs for the update.
For more details, check out the Thrivestack training documentation.
:::
:::note Note
The Pipeline tab is used to check the latest status of your data. Check here if you want to confirm your data is up to date in your reporting.
:::
Reporting Tab
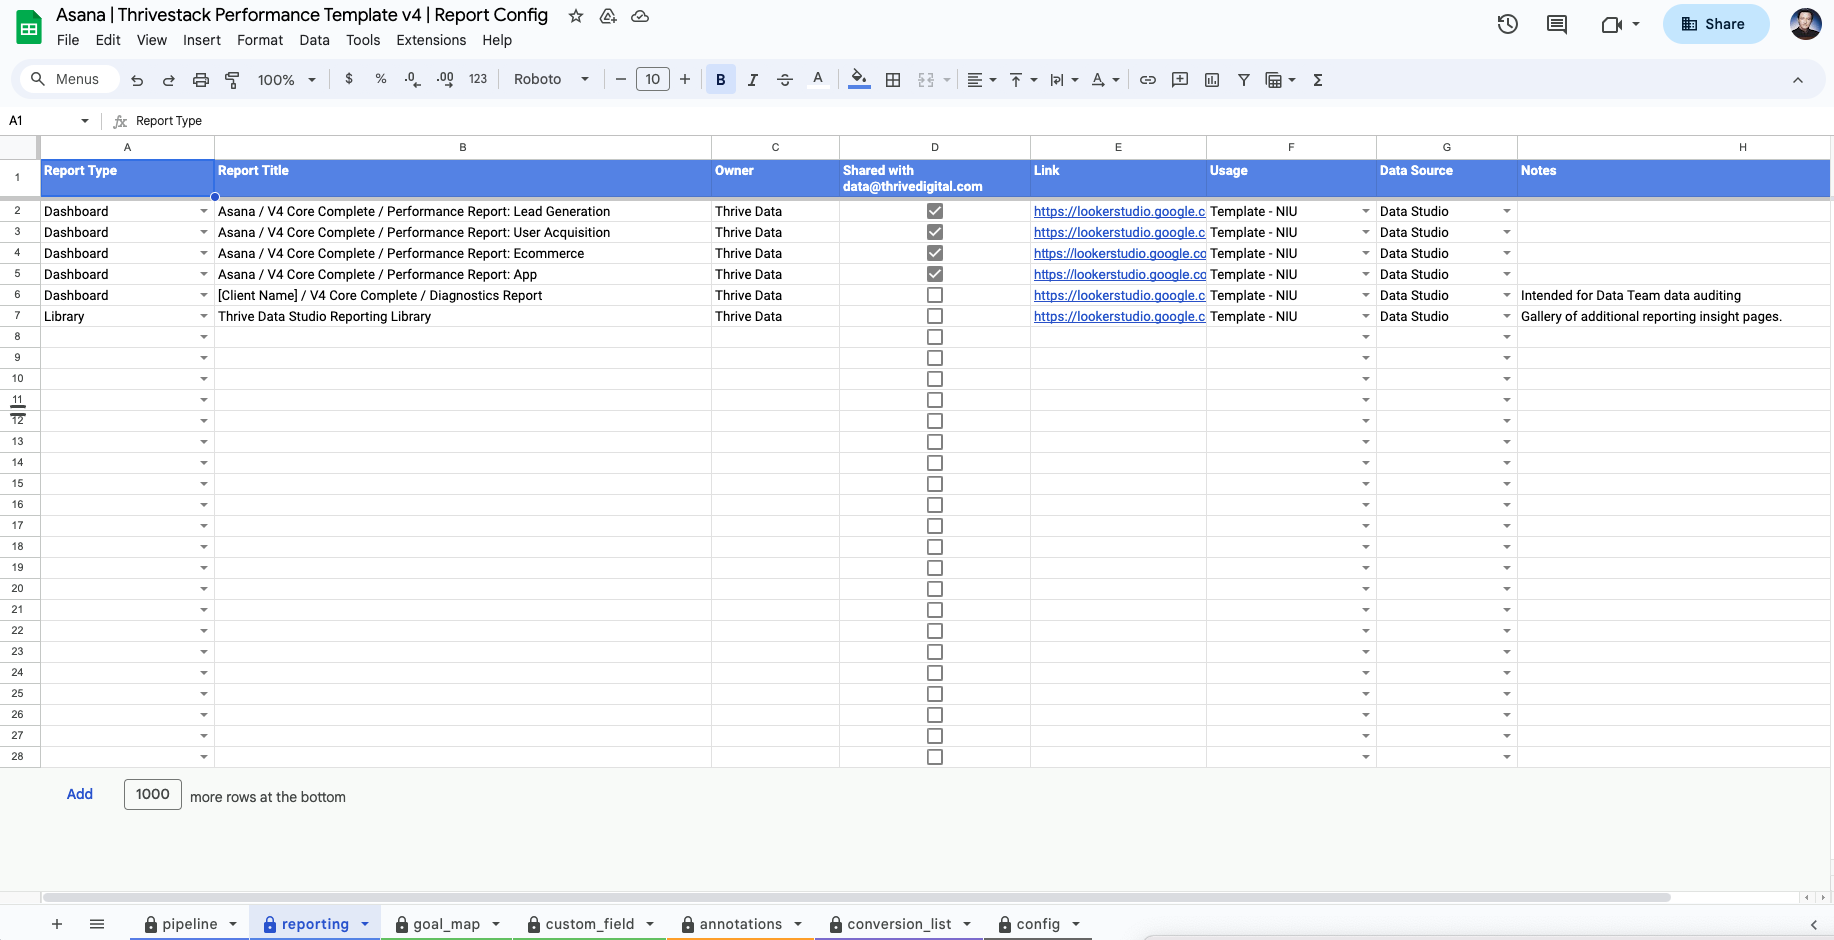
This is where all the reports, budget trackers, SQR reports, pacing sheets, and other documents live. Please update this space with links and share them with data@thrivedigital.com so that we can access the documents without any hurdles.
:::tip Tip
Make sure you also check the mark once it is shared.
:::
:::note Important
The Reporting tab keeps track of all active and inactive reports for the project.
:::
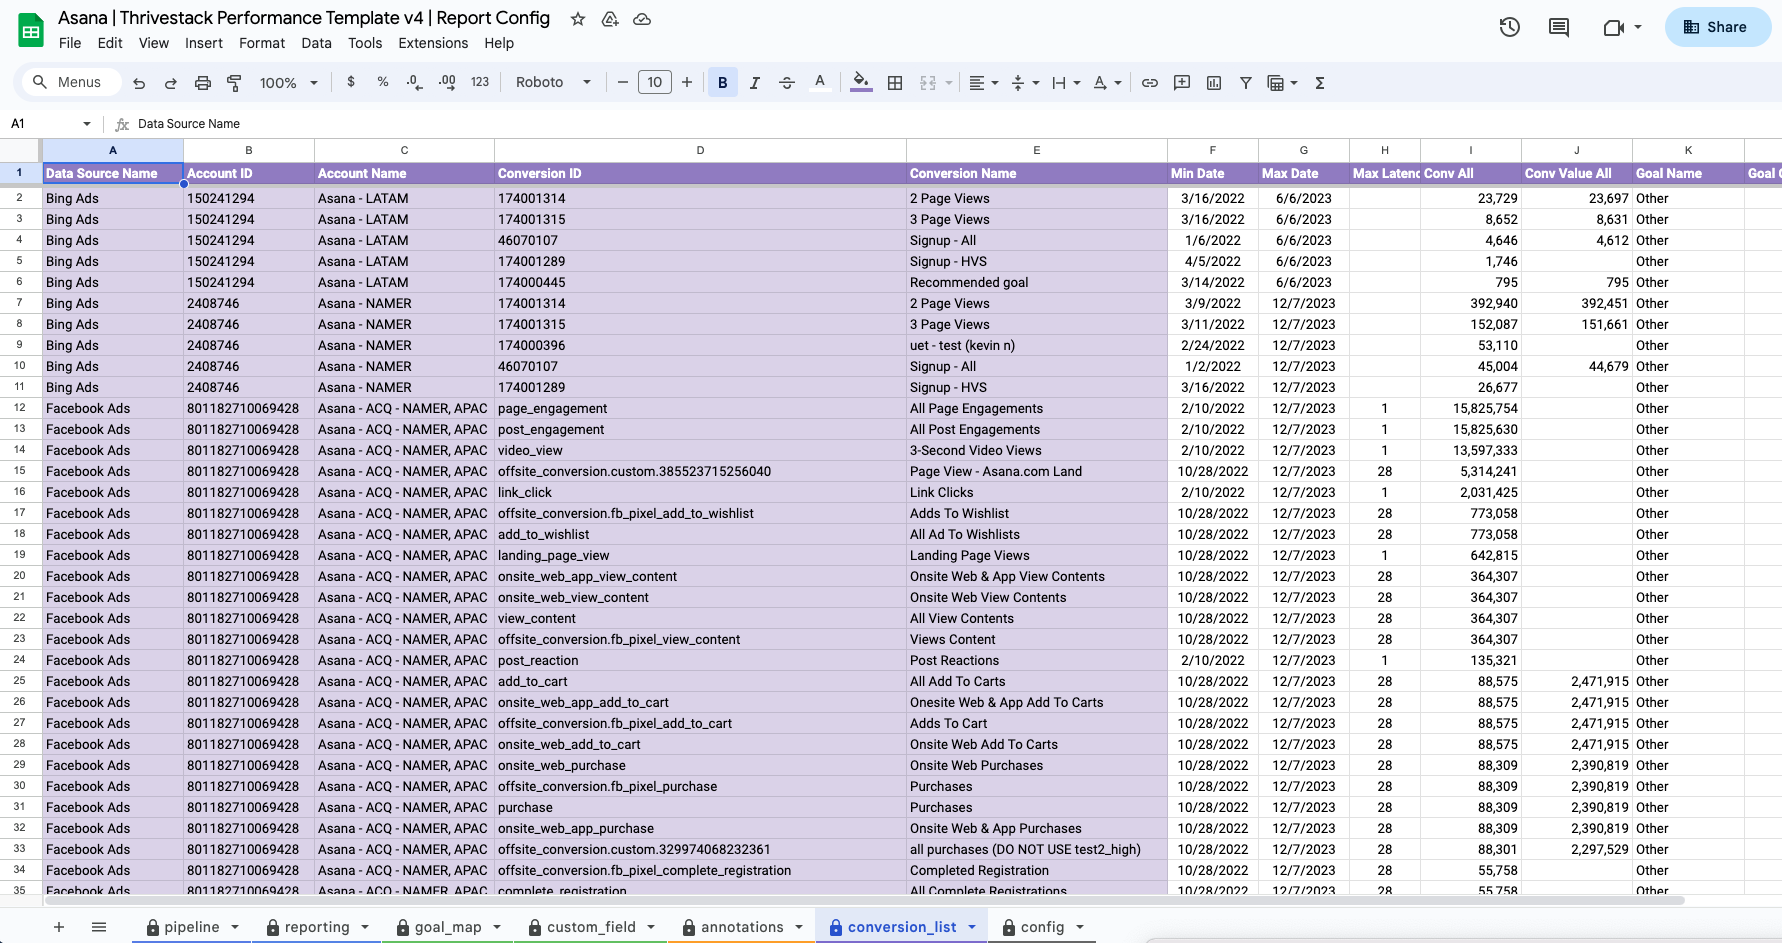
Conversion List Tab
This is a centralized space where we have a list of all the platforms and the conversions recorded. If you're missing or not seeing new conversions in your Looker Studio report, this is a good place to start.
How to use the Conversion List tab
This tab is CRUCIAL for bringing in the right conversions to your reporting.
Column Descriptions:
- A:E (conversion details) - Must copy these cells for goal mapping (more on this topic coming up).
- F:G (min/max dates) - Because we bring in ALL conversions, it may be difficult to distinguish which conversions you want to bring into your reporting. The min date column let's you know how far the conversion dates back to and the max date column shows you the conversion's last recorded date.
- H (max latency) - The max delay for click/viewthrough windows currently set up on the platform (not commonly used).
- I:J (conv all/conv value all) - Sum of all conversions and values.
- K:M (goal details) - If your goals are mapped to the specific conversion, details are populated here.
:::note Important
We use the Conversion List tab to review all conversions across all the different platforms and decide which conversions (goals) we want to bring into our reporting.
:::
Goal Mapping Tab
This tab plays a crucial role when it comes to reflecting conversion data into the Looker Studio reports. Whatever is mapped in this tab, only those goals or conversions will show up in your report.
Context
We bring in all conversions across all the different platforms dating back years ago. Not all conversions are relevant and don't need to be reported on. That said, the purpose of goal mapping is to make sure we only include the conversions that are RELEVANT in our reporting.
We also use goal mapping to standardize the conversion names across the different platforms. For example, in Meta you have the conversion "Purchase" but in GAds you have the conversion "Purchases". If you wanted to report on All Purchases, how would Looker Studio know to report on both these conversions?
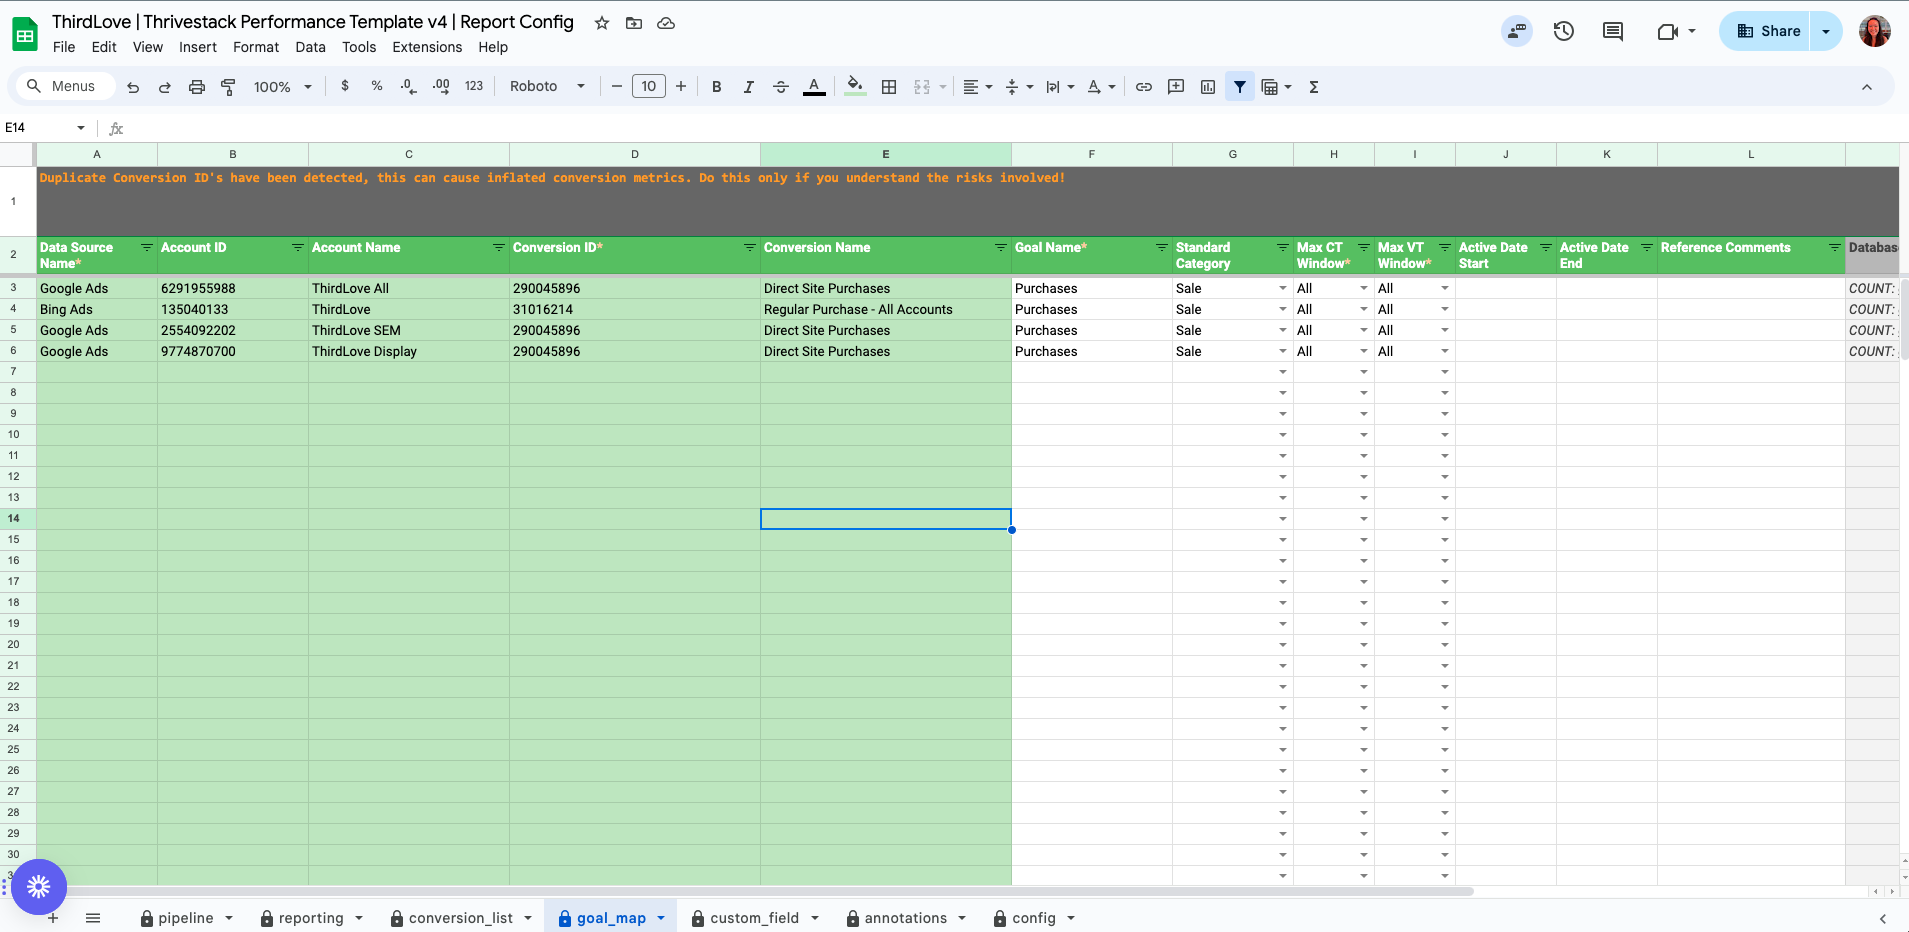
How to map your goals
Column Descriptions:
- A:E (conversion details) - These cells are copied from the Conversion List tab. MAKE SURE TO PASTE AS VALUES!
- F (goal name) - Setting the standard field name to be used in reporting.
- G (standard category) - Because our main reporting is a template, these standard categories are referenced in the majority of charts in our reporting. Make sure to select a standard category for all mapped goals if you'd like the conversion data to be included in the templated charts.
- H:I (CT/VW windows) - Set to "All" for non-Meta platforms, set to platform setting for Meta.
- J:K (active start/end dates) - If you no longer need your conversion or start needing a conversion to be brought into your reporting on a specific date, these can be stated here.
The below video recording shows you how to map your goals correctly.
:::tip Tip
You must run your report sync job then reconnect your Data Studio data source in order to bring in any new goals you just mapped!
:::
:::note Important
We use the Goal Map tab to map our conversions/goals that we wish to bring into our reporting.
:::
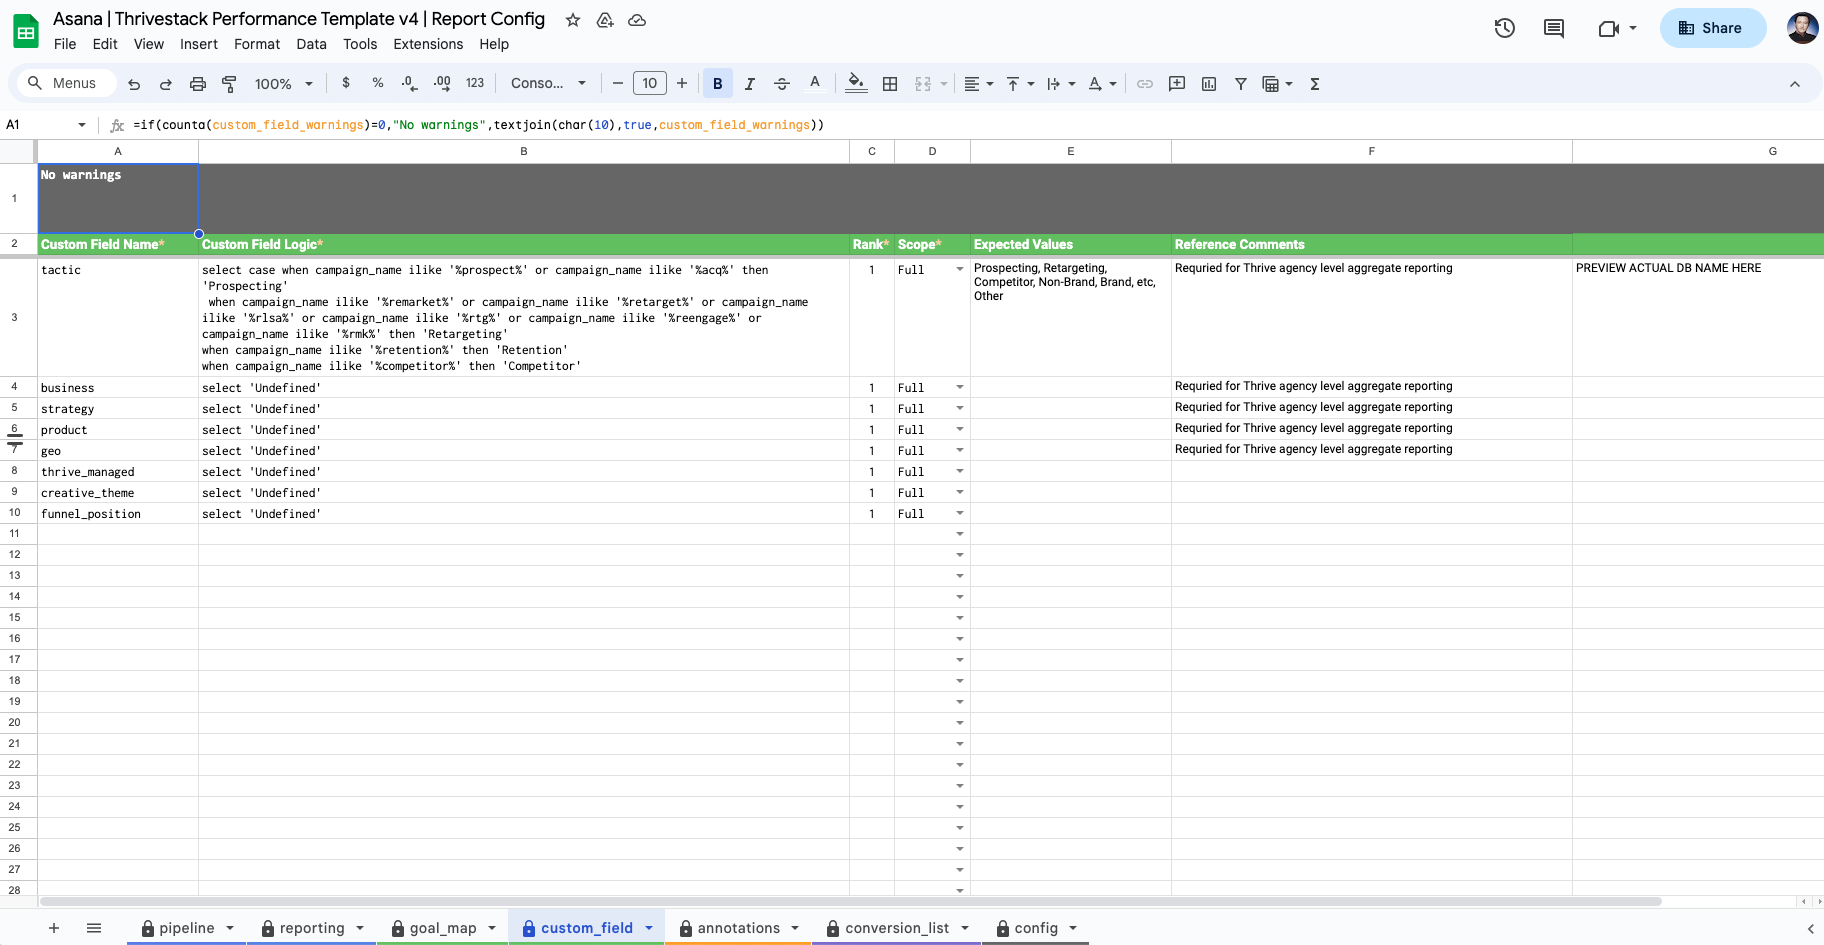
Custom Fields Tab
In our new config sheet, we have made some improvements and added an advanced feature. You can find more on that advanced feature here; it is not compulsory that you use it. It is there if you need it.
The role of the custom_field tab is to manipulate the data that we have. In the screenshot below, in the very first column, we have a custom field name, tactic. In the same custom field logic, it is trying to categorize or split the campaign_name values into separate chunks.
In the custom field logic (B3 cell) ~ there's a case when a condition is written that if the campaign_name has prospect or acq in its name, then that campaign is categorized as Prospecting and so on.
Make sure you follow proper nomenclature and syntax. When you write case-when statements, please close them with an END at the end. Don't miss any single quotes (') otherwise, the GDS/Report job will fail. In that case, feel free to reach out to the data team in the #help-data-support channel.
In our example, the tactic custom field will reflect in gds reports as report_tactic, and report_ will be added for each custom field.
If you want to see these new changes in your report, please run the GDS/Report job. Check the pipeline tab and see who has the report job. We do have a job sharing feature, so despite having this job under someone else, you can still run the job.
We do give Snowflake database read access based on requests, where you can test whether the custom categories you wrote are proper or not and don't have to run the GDS/Report job every single time. So, if you're curious about how they work, feel free to drop a ticket or a question for the data team in the #help-data-support channel.
Find other resources on custom fields:
Find the simple CASE WHEN BUILDER here:
:::note Note
We use Custom Fields to bring in new fields into our reporting.
:::
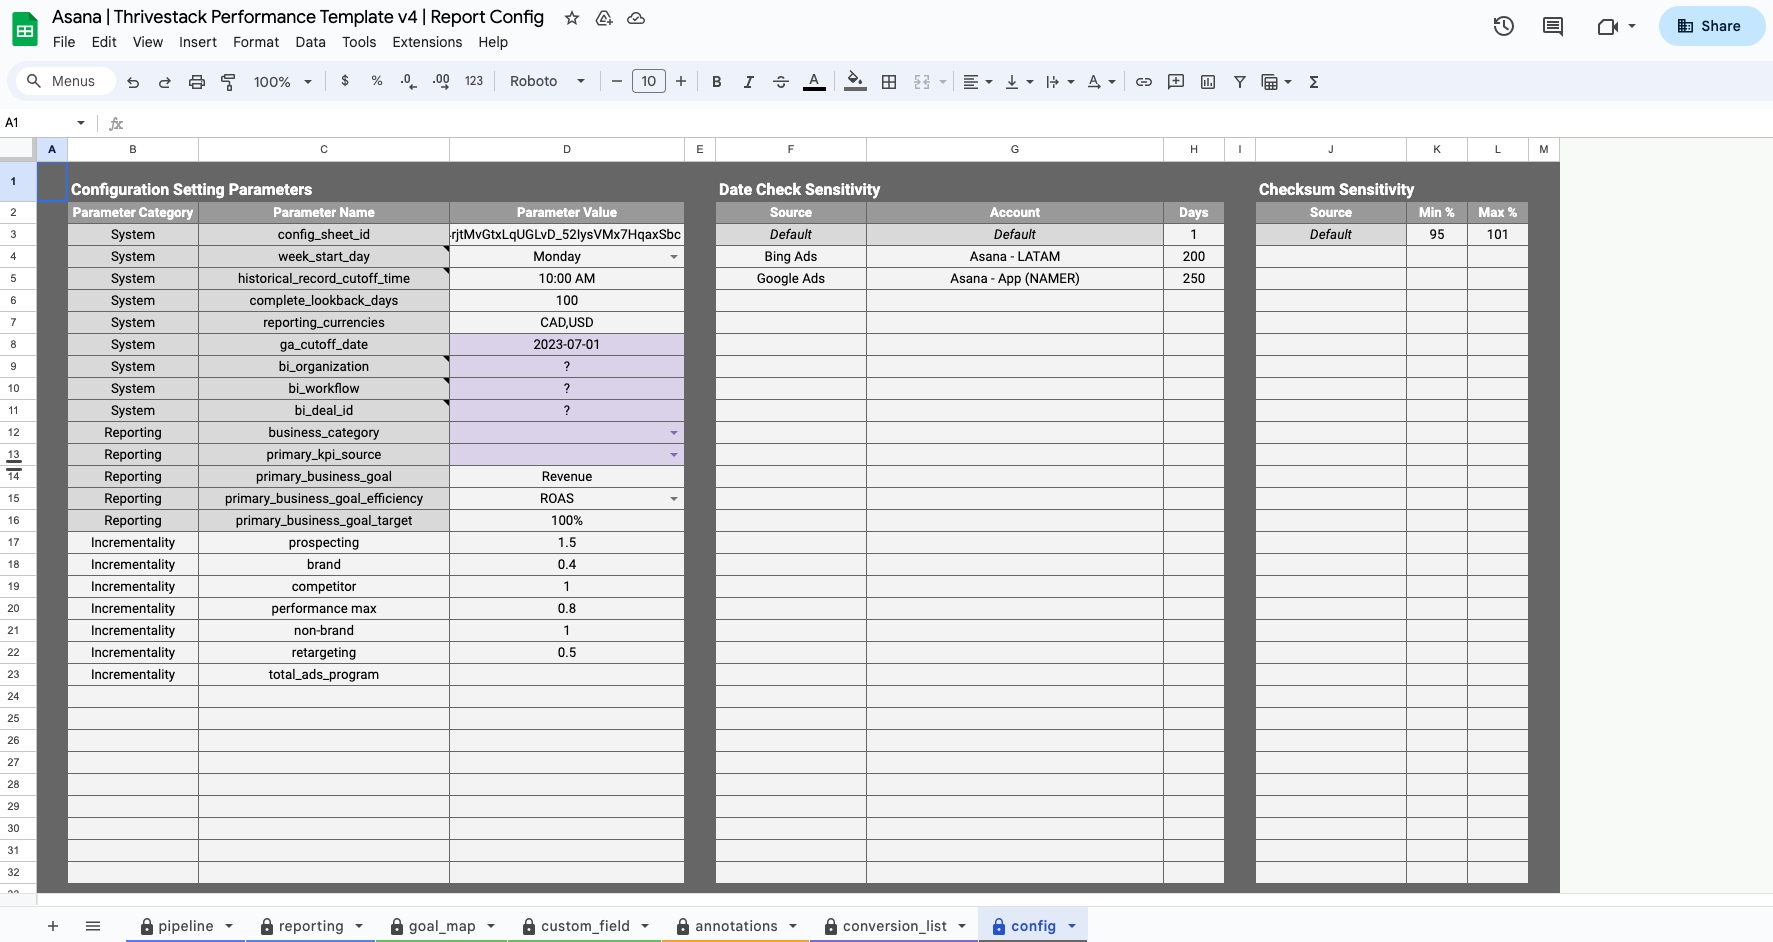
Config Tab
This tab is mostly for the data team. We will update this space when needed.
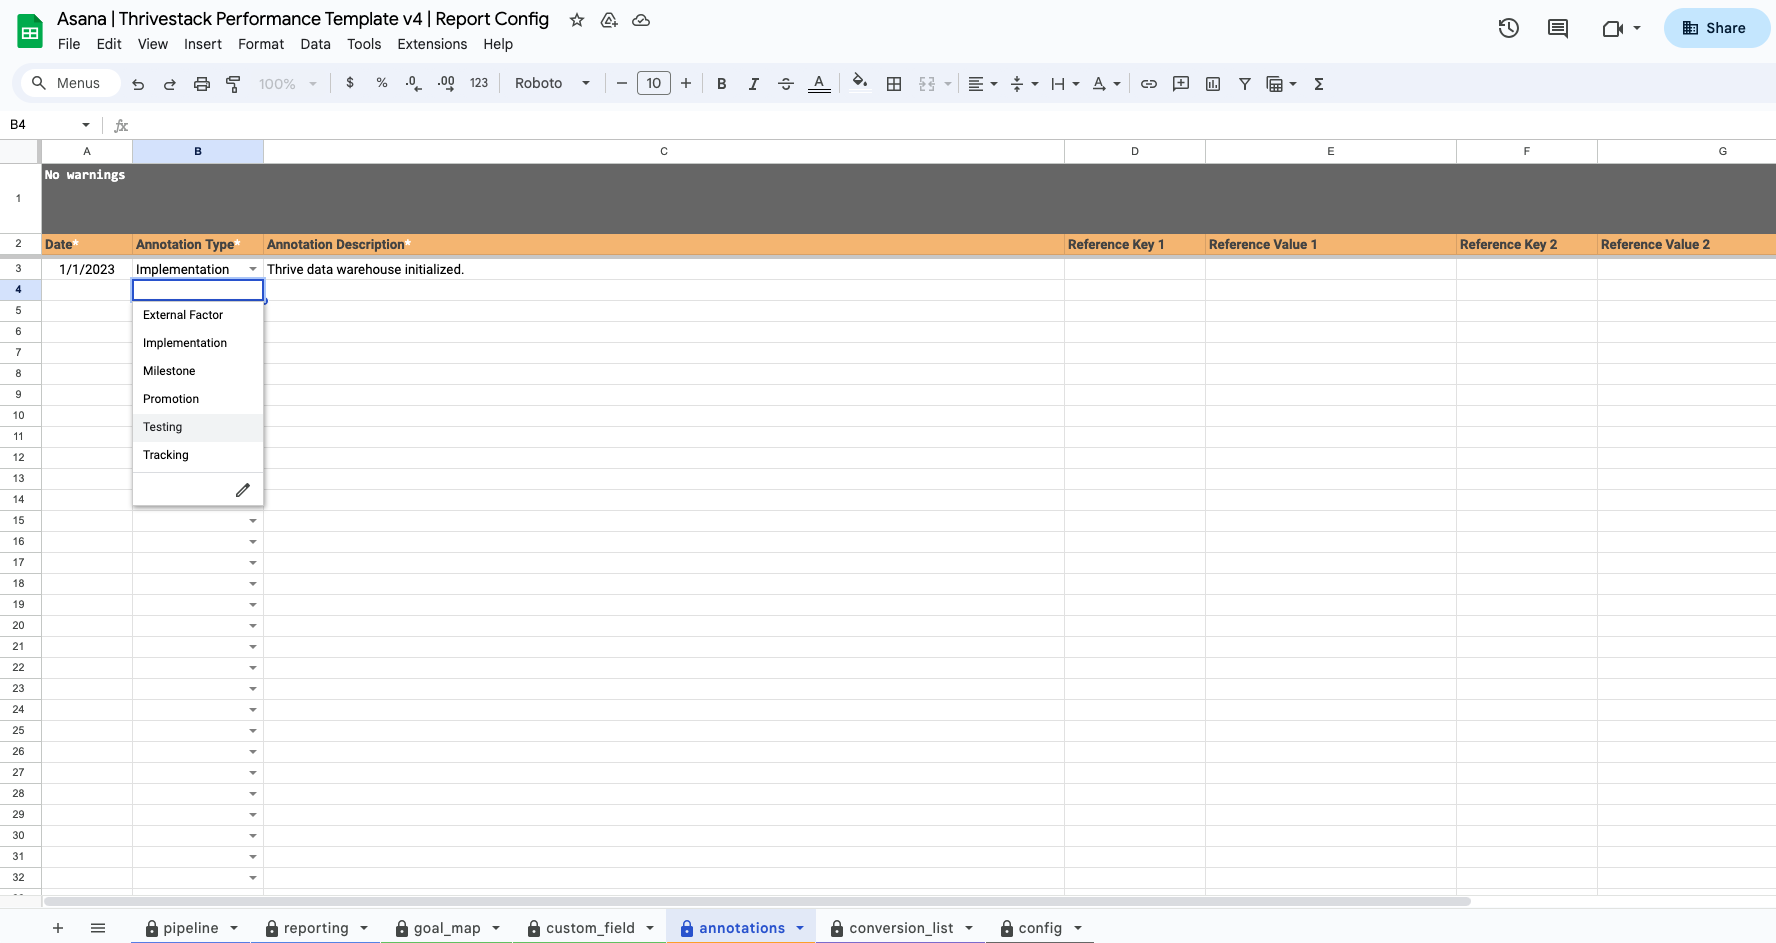
Annotations Tab
Last but not least, this tab is for everyone to keep track of what kind of changes were made and when. If you added a new account, a milestone, or new tracking stuff, you can update this space with dates and descriptions.